
Industry Employment and Wages
Nonfarm Employment

Employment By Sector

Employment Level
Year-over-Year Change
Numeric
%
Percentage

Annual Average Weekly Wages in Arizona ()
$
Total,
All Industries
All Industries
Industry Category
Weekly Wage
$ | |
$ | |
$ | |
$ | |
$ | |
$ |
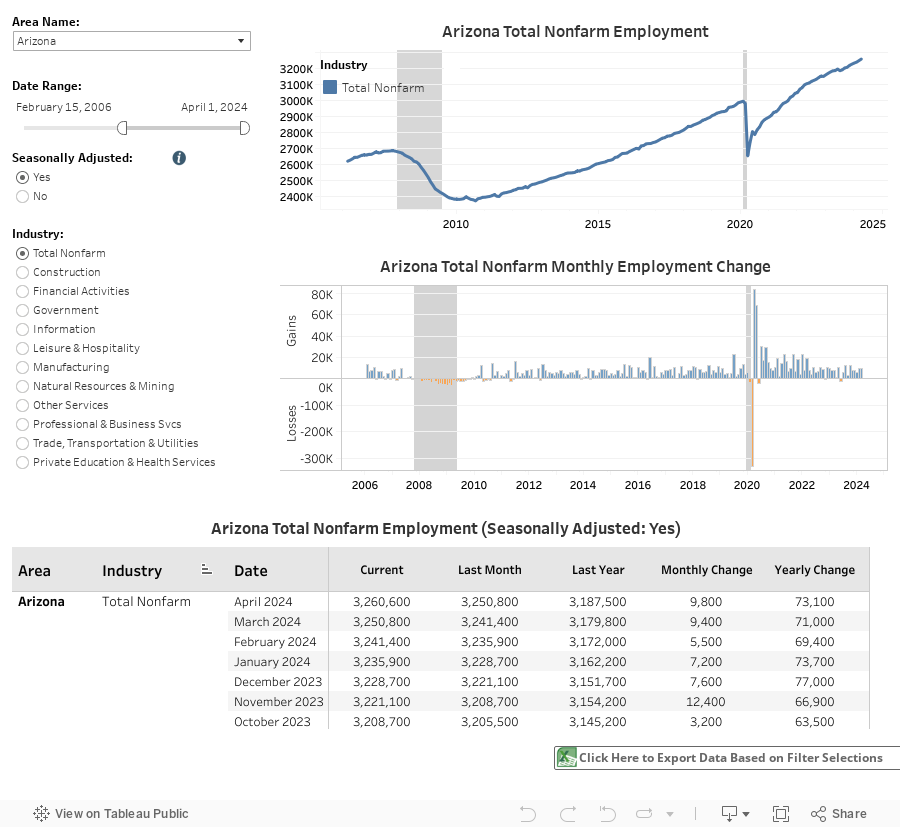
Monthly Employment (CES Program)
Monthly Employment Trends
Data Description
The Current Employment Statistics (CES) program provides the most detailed employment estimates by industry for the U.S., all states, metro areas, and counties.
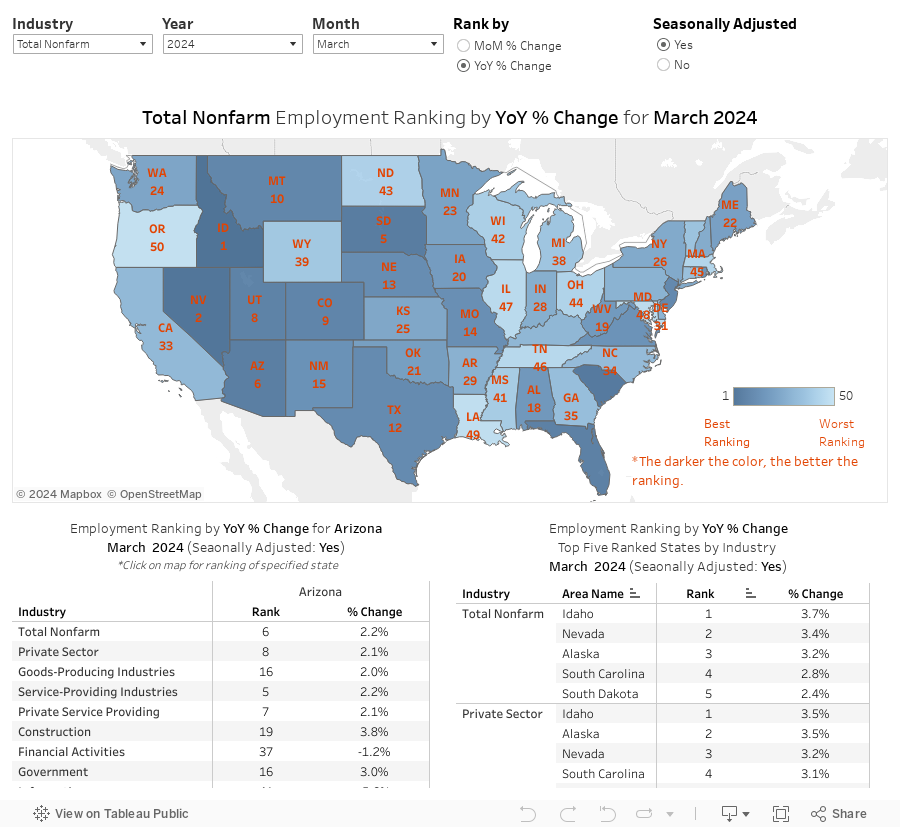
Employment State Rankings
Data Description
The data comes from the Current Employment Statistics (CES) program. The purpose of these data is to analyze state rankings for employment estimates by industry.
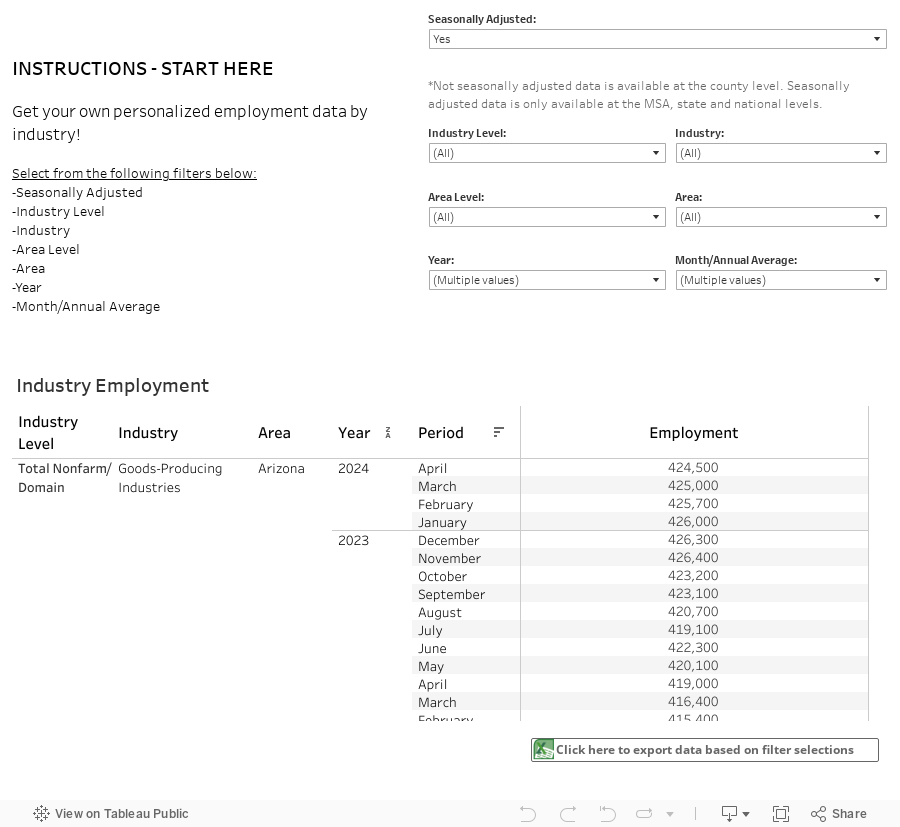
Monthly Employment Custom Data Search
Data Description
The Current Employment Statistics (CES) program provides the most current employment, hours, and earnings data by industry (place of work) for the U.S., all states, metro areas, counties and local workforce areas.
Download the Data
Monthly Employment (CES) Data Tables
Not seasonally adjusted nonfarm employment by industry
State Estimates
| 2020-2023 | Excel | |
| 2010-2019 | Excel | |
| 2000-2009 | Excel | |
| 1990-1999 | Excel |
Metro Area (MSA) Estimates
| 2020-2023 | Excel | |
| 2010-2019 | Excel | |
| 2000-2009 | Excel | |
| 1990-1999 | Excel |
County Estimates
| 2020-2023 | Excel | |
| 2010-2019 | Excel | |
| 2000-2009 | Excel |
Seasonally adjusted nonfarm employment by industry
State Estimates
| 2020-2023 | Excel | |
| 2010-2019 | Excel | |
| 2000-2009 | Excel | |
| 1990-1999 | Excel |
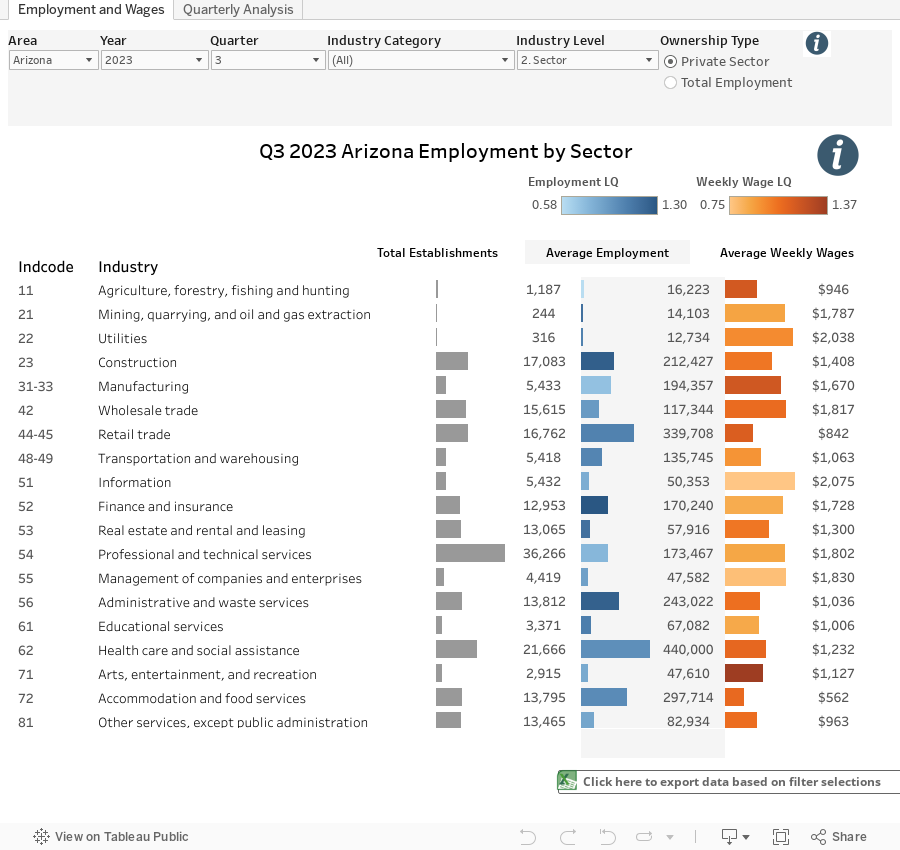
Quarterly Census of Employment and Wages (QCEW)
Quarterly Employment and Wage Trends
Data Description
The Quarterly Census of Employment and Wages (QCEW) program provides the most detailed private sector employment and wage estimates by industry for the U.S., all states, metro areas, and counties.
Download the Data
Monthly Employment (CES) Data Tables
Not seasonally adjusted nonfarm employment by industry
State Estimates
| 2020-2023 | Excel | |
| 2010-2019 | Excel | |
| 2000-2009 | Excel | |
| 1990-1999 | Excel |
Metro Area (MSA) Estimates
| 2020-2023 | Excel | |
| 2010-2019 | Excel | |
| 2000-2009 | Excel | |
| 1990-1999 | Excel |
County Estimates
| 2020-2023 | Excel | |
| 2010-2019 | Excel | |
| 2000-2009 | Excel |
Seasonally adjusted nonfarm employment by industry
State Estimates
| 2020-2023 | Excel | |
| 2010-2019 | Excel | |
| 2000-2009 | Excel | |
| 1990-1999 | Excel |